

Top
Author
Published
16 Jul 2026Form Number
LP2453PDF size
14 pages, 877 KBSubscribed to LP2453.
Thank you for your feedback.
Table of Contents
Abstract
This document provides benchmark results and deployment guidance for running the Microsoft Phi-3 Mini Small Language Model on Lenovo ThinkAgile VX V4 and FX V4 servers with Intel Xeon 6 processors and VMware Cloud Foundation 9.0, without requiring dedicated GPU platforms. Using native PyTorch 2.11 with Intel AMX acceleration, it covers single-node and distributed 16-rank cluster configurations, and translates the results into sizing guidance and deployment architectures for interactive, departmental, high-traffic, and bulk processing workloads.
This paper is intended for IT architects, infrastructure engineers, and technical decision-makers evaluating on-premises generative AI deployments. Readers are expected to have working knowledge of hyperconverged infrastructure, VMware virtualization, and basic LLM inference concepts.
Introduction
Enterprise adoption of AI is increasing, and many adopters are successful in getting ROI and seeing tangible business value. The early adoption of Generative AI across industries shows transformation in the workforce to improve productivity and efficiency, generating creative content, extracting information from a variety of documents, and integrating with other AI/ML use cases.
This brief highlights Lenovo ThinkAgile VX V4 and FX V4 on-prem infrastructure solutions as an influencer of AI adoption rate. These systems, integrated with VMware Cloud Foundation (VCF) 9.0 and powered by Intel Xeon 6 processors with integrated AI accelerators, can address inferencing performance objectives for SLM workloads while reducing system complexity and deployment costs. The solution empowers CPU-based AI/ML inference deployment natively, using uncompressed bfloat16 models and a native PyTorch orchestration stack, and demonstrates cluster-wide horizontal scaling with fully predictable capacity growth.
For smaller organizations seeking to maximize single-node efficiency through quantized low-precision weight formats (INT4 and INT8 compression, executed locally within isolated, NUMA-bound virtual machines) on the Nutanix hyperconverged platform, see the companion Lenovo Press technical brief, Optimizing CPU-Based SLM Inference on Lenovo ThinkAgile HX V4 and FX V4 Servers with Nutanix.
Lenovo ThinkAgile VX V4 and FX V4 Systems with Intel Xeon 6 Processors
The Lenovo ThinkAgile VX650 V4 and FX650 V4 are 2-socket, 2U systems and The Lenovo ThinkAgile VX630 V4 and FX630 V4 are 2-socket, 1U systems. These hyperconverged systems features Intel Xeon 6 processors and powered by vSAN ESA and VMware Cloud Foundation and the servers support up to 86 cores, higher memory bandwidth and capacity, PCIe 5.0 I/O, and performance optimized all NVMe storage configuration to meet various workloads including databases, virtualization, VDI, analytics, AI/ML and ERP.


Figure 1. ThinkAgile VX650 V4 (top) and VX630 V4 (bottom) designed for VMware hyperconverged infrastructure
ThinkAgile FX offers a unique, industry first flexibility for software-defined approach to hyper convergence, leveraging the ability to move between hypervisors of your choice to deliver compute, storage and management in a tightly integrated software stack and future-proof your investment with seamless HCI software transitions.


Figure 2. ThinkAgile FX650 V4 (top) and FX630 V4 (bottom) designed for flexible hyperconverged infrastructure
Native AI Software Stack: The Shift to Upstream PyTorch
Historically, hardware-specific optimization on Intel architectures required the use of the Intel Extension for PyTorch (IPEX). However, Intel has successfully upstreamed their core features and optimizations directly into the official PyTorch code base.
Active development on IPEX has been discontinued. Modern enterprise architectures now utilize native PyTorch (version 2.8+), which seamlessly integrates high-performance LLM inference and deep hardware optimizations. Utilizing the built-in torch.compile method alongside the TorchInductor backend allows the framework to automatically map mathematical operations to the AMX capabilities of the Granite Rapids silicon through the oneDNN library, with no vendor-specific packages required.
Intel AMX
Intel Advanced Matrix Extensions (Intel AMX) is a set of instructions designed to work on matrices, natively accelerating AI fine-tuning and inference workloads on the CPU. Its architecture supports bfloat16 (training/inference) and int8 (inference) data types.
The Intel AMX architecture relies on two components:
- Tiles: These consist of eight two-dimensional registers, each 1 kilobyte in size, that store large chunks of data.
- Tile Matrix Multiplication (TMUL): TMUL is an accelerator engine attached to the tiles that performs matrix-multiply computations for AI.
AMX primarily accelerates the compute-bound prefill phase of LLM inference (prompt processing). The decode phase (token generation) is bound by memory bandwidth rather than compute, a distinction that shapes the sizing guidance throughout this paper.
Hardware Configuration
The testing was performed with a 4-node Lenovo ThinkAgile VX650 V4 cluster equipped with two Intel Xeon 6747P 48-core processors with Hyper-Threading enabled. This provided a high-density compute platform for virtualized workloads.
Note: Physical validation was executed exclusively on the 2U, 2-socket VX650 V4 servers. Because the VX630 V4, FX630 V4, and FX650 V4 share the same processor options and memory subsystem, performance characteristics are expected to transfer closely; results on other chassis have not been independently measured.
The table below lists the configuration of the nodes we tested.
The table below lists the VM configuration and software stack.
Testing Methodology
To validate the capabilities of the Lenovo ThinkAgile V4 platform running VCF 9.0, a benchmarking methodology was designed to test both raw silicon-level efficiency and real-world operational scalability.
- Orchestration (torchrun): Rank launch was managed through the torchrun utility, which coordinated 16 inference ranks across the cluster with barrier-aligned measurement windows.
- Parallelism model (Data Parallelism): Phi-3-mini (3.8B parameters, ~7.6 GB in bfloat16) fits entirely within a single vNUMA domain. The architecture therefore deploys independent model replicas — one per vNUMA node, four per VM, sixteen cluster-wide — with no tensor exchange between ranks or nodes. Tensor parallelism was deliberately excluded: for sub-8B models, per-token cross-domain synchronization idles the compute engines and degrades throughput. During inference, no model data crosses the network; the 25GbE fabric is used only to launch the ranks and synchronize the start of each measurement.
- Execution Stack (Native PyTorch): Native PyTorch (version 2.11) with the TorchInductor backend and oneDNN AMX dispatch.
- Hardware Affinity (numactl): Strict CPU and memory pinning confined each rank to its local vNUMA boundary — 24 threads per rank, the saturation profile referenced in all result tables — maximizing cache locality and eliminating cross-socket UPI traffic. Hypervisor-level vNUMA affinity and guest-level pinning were applied identically to all runs, single-VM and cluster.
- Model precision: All results in this paper were measured at native bfloat16 precision using the unmodified microsoft/Phi-3-mini-128k-instruct weights (~7.6 GB). No quantization (INT8/INT4) or weight compression was applied. Bfloat16 is the native AMX-accelerated datatype on Intel Xeon 6 and preserves full model quality
Measurements were taken with a warm compilation cache, so torch.compile optimization time is excluded from reported latencies; reproductions from a cold environment should discard the first pass. Three quantities are reported per scenario, each directly measured on the instrumented rank:
- TTFT — Time to First Token (s): the delay before the system begins producing output in response to a request; lower is better. TTFT captures perceived responsiveness and is dominated by the compute-bound prefill phase.
- TPOT — Time Per Output Token (ms): the average time to generate each output token after the first, also known as inter-token latency; lower is better. For long-form outputs, where hundreds of tokens are generated, TPOT dominates total response time and determines the user-perceived streaming rate (per-user speed = 1000 ÷ TPOT).
- Rank throughput (t/s): generated output tokens divided by end-to-end wall time; input tokens are never counted.
The per-rank batch sizes follow the standard doubling convention for inference sweeps, providing logarithmic coverage of the concurrency range and direct comparability with published LLM benchmarks. With four ranks per VM, they correspond to 4, 16, 32, and 64 concurrent streams per VM, representing distinct enterprise service tiers:
- 4 streams — interactive chat baseline, establishing best-case per-user TTFT and TPOT;
- 16 streams — departmental concurrency, the onset of memory-bandwidth sharing across streams;
- 32 streams — high-traffic internal applications, the operational balance point between aggregate throughput and per-user latency;
- 64 streams — bulk processing and audit workloads, the maximum-stress tier that locates the throughput ceiling and, at longer context lengths, the Concurrency Crossover Point.
Test Results
The engineering validation phase yielded architectural insights regarding CPU optimization, memory-bandwidth behavior, and the scaling characteristics of the VMware Cloud Foundation (VCF) 9.0 fabric. Testing utilized the Microsoft Phi-3-mini (3.8B) Small Language Model to evaluate both isolated-node capability and cluster-scale behavior of independent, NUMA-pinned model replicas.
The primary objective was to determine the Concurrency Crossover Point, the enterprise load at which an isolated virtual machine, bound by the fixed memory bandwidth of its physical sockets, can no longer meet per-user latency objectives, mandating the transition to a distributed, multi-node architecture.
Single-VM Per-Rank Performance
To establish the hardware baseline, inference workloads were first localized to a single virtual machine running four concurrent, independent ranks, one per vNUMA node, with measurement start aligned across ranks. Performance is therefore recorded while all four ranks are running simultaneously, so the measured rank competes with the other three for the VM's memory bandwidth, reflecting realistic operating conditions rather than an idle system.
In the results in the table below, concurrent streams per VM equal batch size per rank × 4. TTFT and TPOT are reported per stream, and rank throughput is the directly measured generation rate of the measured rank.
Two behaviors define the single-node profile:
- Per-rank generation rises with concurrency at short contexts, from 8.4 to 86.4 tokens per second per rank, as concurrent streams amortize weight reads during the memory-bound decode phase (see the figure below).
- Per-user speed simultaneously declines, gracefully at short contexts from 8.6 to 5.6 tokens per second, and sharply at long contexts, where growing KV-cache traffic and prompt-processing cost compound.
This latency degradation profile, not raw throughput, determines when a single node must be scaled out.
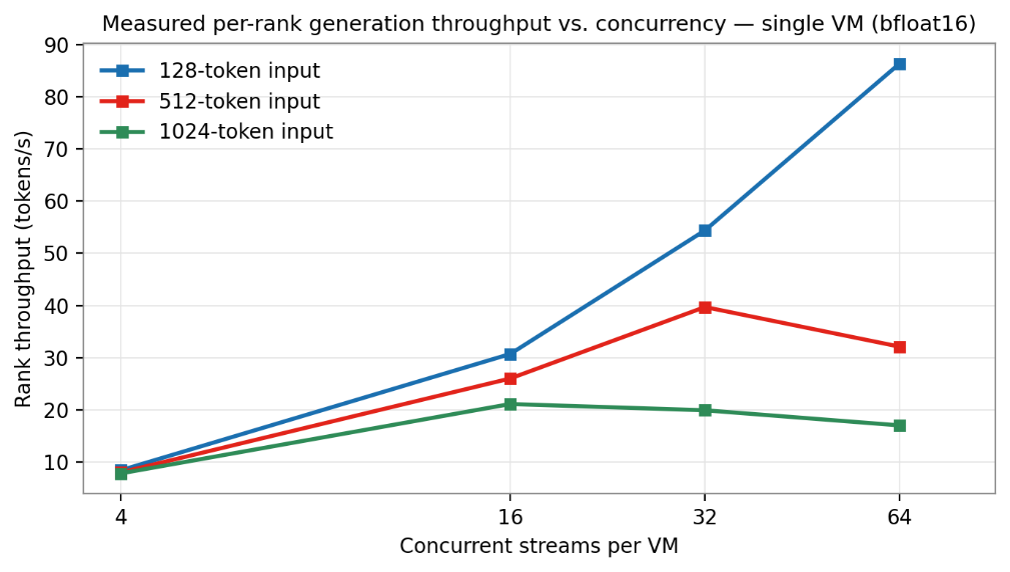
Figure 3. Measured per-rank generation throughput versus concurrency on a single VM
Distributed Cluster Performance
To characterize cluster-scale behavior, the same workload matrix was executed on all four VMs at once, for a total of 16 concurrent ranks. The ranks were launched by torchrun over the 2×25 Gbps management network, with measurement start aligned across all ranks. Because each rank is an independent replica, inference runs entirely within its own node: no model data crosses the network, which is used only to launch the ranks and synchronize the start of each measurement.
In the results in the following table, concurrent streams cluster-wide equal batch size per rank × 16. One rank per node is measured, and the four per-node results are averaged.
Scaling Validation
At matched per-rank load, the measurements in Table 4 (16 ranks across four nodes) show TTFT, TPOT, and rank throughput equal to or better than Table 3 (4 ranks on one VM) in all but the heaviest long-context cell, where the difference lies within single-run variance, demonstrating that distribution imposes no systematic per-rank cost, as shown in the following figure.
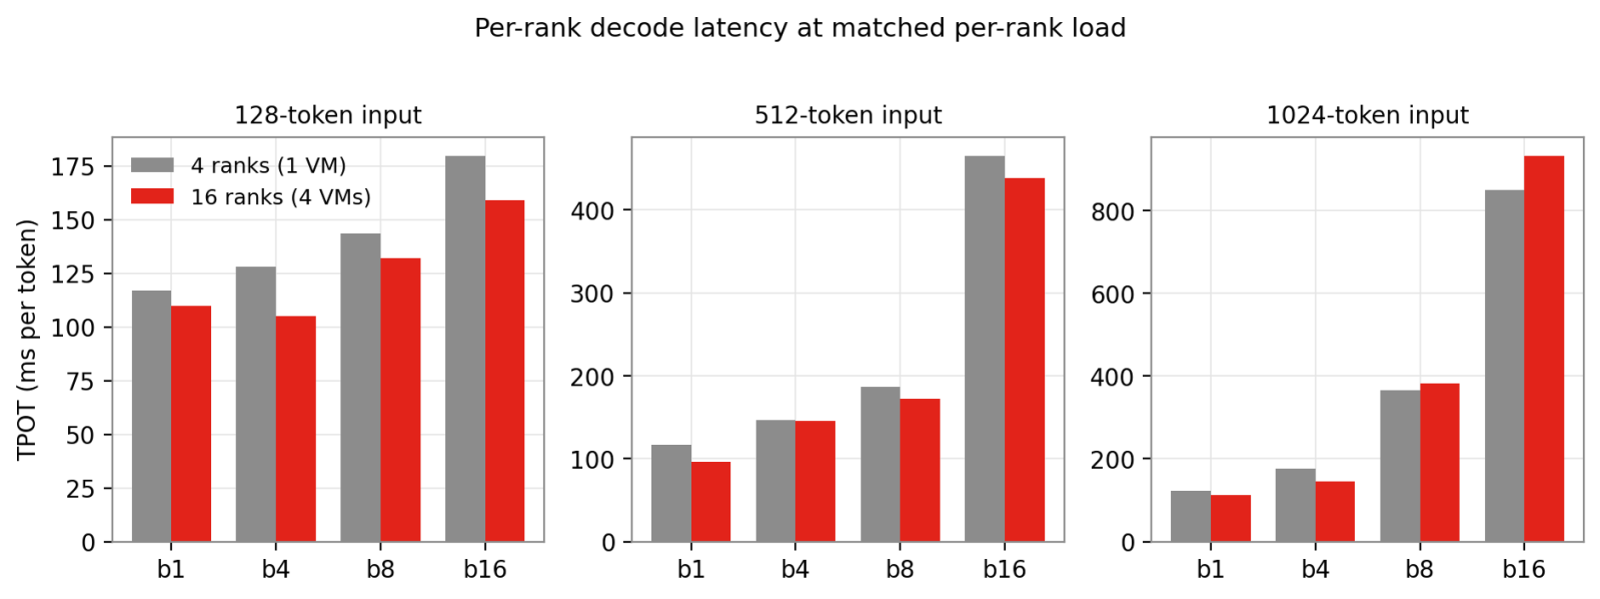
Figure 4. Per-rank decode latency at matched per-rank load, 4 ranks on one VM versus 16 ranks across four VMs
Comparative Analysis: The Concurrency Crossover Point
A Service Level Objective (SLO) defines the per-user latency commitment of a deployment, expressed through the two indicators measured in this paper: TTFT and TPOT. Capacity is evaluated against two profiles:
- SLO-A (TPOT ≤ 130 ms, TTFT ≤ 3 s): low-latency conversational workloads
- SLO-B (TPOT ≤ 200 ms, equivalent to 5 tokens per second per user; TTFT ≤ 5 s): streaming assistant and interactive AI-assistant workloads.
Token generation for a 3.8B-parameter model in bfloat16 is governed by memory bandwidth: every generated token streams the full 7.6 GB weight set, and a node's bandwidth is fixed by its physical sockets. Per-rank generation therefore rises with concurrency, as streams amortize weight reads, while per-user latency simultaneously degrades as the fixed memory subsystem is divided across more streams. A single VM never becomes slower than its share of a cluster; it becomes insufficient — its latency deteriorates past the SLO while aggregate output continues to climb.
The Concurrency Crossover Point is the measured concurrency level at which a single node can no longer meet its SLO and horizontal scale-out becomes necessary. Because per-rank latency is invariant under scale-out (Table 3 and Table 4), the analysis is read directly from measured TTFT and TPOT.
Organizations with different latency commitments may derive their own thresholds directly from the Table 3 data: the crossover is a function of the latency objective in effect, not a single universal value.
Thresholds fall as context grows, because longer prompts cost more to process and each stream's KV cache adds memory traffic, as shown in the following figure.
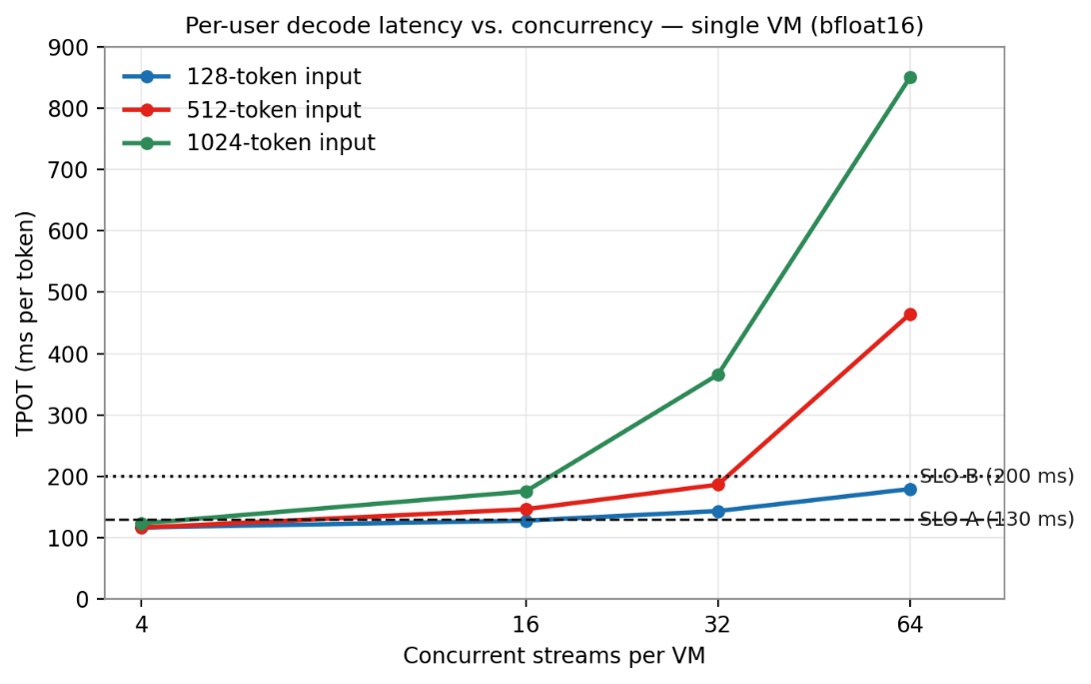
Figure 5. Measured per-user decode latency (TPOT) versus concurrency on a single VM, with SLO thresholds
Beyond the first failing load, degradation accelerates: at 64 streams and 1024-token inputs, TTFT reaches 23.6 seconds and per-user generation falls to roughly one token per second. Every threshold is TPOT-bound, and the values are bracketed by the tested loads of 1, 4, 8, and 16 streams per rank. Contexts above 1024 tokens were not measured, so deployments with longer prompts, such as retrieval-augmented generation, should validate at representative lengths. Latency targets below SLO-A are not achievable in this bfloat16 configuration, since per-NUMA-domain memory bandwidth limits single-stream decode to about 117 ms per token, and requirements for sub-second TTFT or TPOT under roughly 100 ms therefore call for quantized formats or accelerator-based serving.
Resizing the VM does not move the crossover, because memory bandwidth belongs to the physical sockets rather than to vCPU counts. Beyond the crossover, capacity is added node by node, with each node contributing four ranks at unchanged per-rank latency, and sizing follows a single rule:
Nodes required = peak concurrent streams ÷ single-VM crossover threshold for the context length and SLO (rounded to the next whole value)
Under SLO-B, a service peaking at 256 short-context sessions requires 4 nodes, which is the configuration measured in Table 4 at 96.7 tokens per second per rank and a TPOT of 159 ms. Under SLO-A the same workload requires 16 nodes, a difference that quantifies the cost of the stricter latency commitment. Batch workloads without a per-user latency objective may instead run a single VM to its bandwidth ceiling before scaling out.
Conclusion
The validation of Phi-3 on Lenovo ThinkAgile VX V4 and FX V4 systems demonstrates that enterprise SLM inference can be deployed effectively on standard CPU infrastructure with fully predictable scaling behavior, established here on the strength of direct instrumentation alone.
A single 96-vCPU VM hosted on a VX650 V4 node sustains interactive per-user latency under SLO-B for 64 concurrent short-context streams, 32 streams at 512-token contexts, and 16 streams at 1024-token contexts, with per-user generation of 5 to 9 tokens per second. Scaling from 4 ranks on one VM to 16 ranks across four leaves per-rank performance unchanged within single-run variance, establishing that service quality is set per rank while capacity is set by rank count, and these two facts jointly define the platform's sizing law.
Generation speeds in this class suit chat, streaming assistant workloads, and document workloads at substantially lower cost and complexity than dedicated accelerator infrastructure, while workloads requiring GPU-class responsiveness remain outside the scope of this validation. By aligning Intel Xeon 6 hardware capabilities with VMware Cloud Foundation 9.0, Lenovo provides a measured and reproducible blueprint for sizing SLM inference in the enterprise: capacity planning begins with a single node and grows by simple division.
Bill of Materials
The bill of materials listed in the following table is the standardized transaction and ordering configuration recommended for an enterprise deployment of this solution. The performance testing was conducted using Intel Xeon 6747P (48-core, 330W) processors paired with 1.5TB of RAM.
Conversely, this production BOM specifies dual Intel Xeon 6737P (32-core, 270W) processors and 512GB of TruDDR5 memory as a cost-optimized entry point for standard SLM inferencing. Because the Phi-3-mini model footprint requires less than 10GB of capacity per replica, the 512GB layout safely accommodates multiple concurrent model ranks.
Note that decode throughput is governed by memory bandwidth rather than core count, so the 32-core configuration is expected to deliver comparable generation throughput when populated with all memory channels; prefill (TTFT) performance scales with core count and will be moderately lower than the 48-core testbed. Deployments with strict TTFT objectives at long context lengths should validate against the methodology in this paper or select the 48-core option.
Resources
For more information, see these resources:
- Lenovo ThinkAgile VX650 V4 Hyperconverged System
https://lenovopress.lenovo.com/lp2135-lenovo-thinkagile-vx650-v4-hyperconverged-system - Lenovo ThinkAgile VX630 V4 Hyperconverged System
https://lenovopress.lenovo.com/lp2134-lenovo-thinkagile-vx630-v4-hyperconverged-system - Lenovo ThinkAgile FX650 V4 Hyperconverged System
https://lenovopress.lenovo.com/lp2338-lenovo-thinkagile-fx650-v4-hyperconverged-system - Lenovo ThinkAgile FX630 V4 Hyperconverged System
https://lenovopress.lenovo.com/lp2337-lenovo-thinkagile-fx630-v4-hyperconverged-system - PyTorch — torch.compile Documentation
https://docs.pytorch.org/docs/stable/generated/torch.compile.html - PyTorch — torch.compiler and TorchInductor Documentation
https://docs.pytorch.org/docs/stable/user_guide/torch_compiler/torch.compiler.html - PyTorch — Distributed Communication Package / torch.distributed
https://docs.pytorch.org/docs/stable/distributed.html - Intel — Accelerate AI with Intel Advanced Matrix Extensions
https://cdrdv2-public.intel.com/794441/amx-quick-start-guide.pdf - Microsoft Phi-3 Mini 128K Instruct — Hugging Face Model Card
https://huggingface.co/microsoft/Phi-3-mini-128k-instruct - Intel AI Development Software
https://www.intel.com/content/www/us/en/developer/topic-technology/artificial-intelligence/development-software.html
Author
Cristian Ghetau is an Advisory Engineer for Lenovo in Romania and has experience in Cloud Infrastructure technologies. He has had more than 13 years of experience working with virtual environments from VMware, Microsoft, Oracle, and Linux.
Trademarks
Lenovo and the Lenovo logo are trademarks or registered trademarks of Lenovo in the United States, other countries, or both. A current list of Lenovo trademarks is available on the Web at https://www.lenovo.com/us/en/legal/copytrade/.
The following terms are trademarks of Lenovo in the United States, other countries, or both:
Lenovo®
ThinkAgile®
ThinkSystem®
XClarity®
The following terms are trademarks of other companies:
Intel®, the Intel logo and Xeon® are trademarks of Intel Corporation or its subsidiaries.
Microsoft® is a trademark of Microsoft Corporation in the United States, other countries, or both.
Other company, product, or service names may be trademarks or service marks of others.
Configure and Buy
Please select a locale
Full Change History
Course Detail
Employees Only Content
The content in this document with a is only visible to employees who are logged in. Logon using your Lenovo ITcode and password via Lenovo single-signon (SSO).
The author of the document has determined that this content is classified as Lenovo Internal and should not be normally be made available to people who are not employees or contractors. This includes partners, customers, and competitors. The reasons may vary and you should reach out to the authors of the document for clarification, if needed. Be cautious about sharing this content with others as it may contain sensitive information.
Any visitor to the Lenovo Press web site who is not logged on will not be able to see this employee-only content. This content is excluded from search engine indexes and will not appear in any search results.
For all users, including logged-in employees, this employee-only content does not appear in the PDF version of this document.
This functionality is cookie based. The web site will normally remember your login state between browser sessions, however, if you clear cookies at the end of a session or work in an Incognito/Private browser window, then you will need to log in each time.
If you have any questions about this feature of the Lenovo Press web, please email David Watts at dwatts@lenovo.com.


