

Top
Authors
Published
13 Mar 2023Form Number
LP1706PDF size
11 pages, 1.7 MBSubscribed to LP1706.
Thank you for your feedback.
Table of Contents
Abstract
GPU power consumption has been increasing from generation to generation to fulfill various kinds of workloads such as traditional HPC, AI, and Deep Learning. It is a common understanding that to maximize GPU performance you must also maximize GPU power consumption. However, it is not always the case that the increase in GPU performance has a direct correlation to an increase in GPU power consumption. In other words, we could reduce GPU power while maintaining a certain level of application performance.
This paper analyzes GPU behavior and the relationship between performance and power by running the SPEChpc 2021 benchmark with different power levels using the NVIDIA H100 GPU on Lenovo ThinkSystem SR655 V3 server. This paper is intended for data center managers and those interested in the relationship between GPU power consumption and performance.
Introduction
The power level of a GPU (graphics processing unit) can have a significant impact on its performance. GPU power level refers to the amount of power supplied to the GPU by the system. Generally, increasing the power level can result in higher GPU clock speeds and better performance, but it also increases power consumption and can generate more heat. To analyze the performance impact of GPU power level, we conduct the SPEChpc 2021 benchmark tests using various GPU power levels and measure the resulting performance. To avoid other factors that may impact the performance, we’ve ensured the CPU and memory are under good status without throttle and consistent ambient temperature when adjusting the GPU power level.
SPEChpc 2021 benchmark
To address the dramatically increase in workload in the High-Performance Computing (HPC) area, more and more modern HPC systems are built with heterogeneous architecture, which means accelerators such as GPU are part of the system to help improve the overall system performance. However, the heterogeneous design needs compiler evolution to overcome the portability challenge across both homogeneous and heterogeneous systems.
In addition, such heterogenous designs also increase complexity and poses challenges to performance evaluation. The High-Performance Group (HPG) under the Standard Performance Evaluation Corporation (SPEC) organization has developed industry-standard HPC benchmark called SPEChpc 2021 to support multiple host and accelerator programming model for modern HPC systems. The SPEChpc 2021 suite supports pure MPI, MPI+OpenMP, MPI+OpenMP target offload, MPI+OpenACC to address the majority type of heterogeneous HPC systems.
The following table lists all the sub-benchmark names, implementation language and each application area.
To fit different cluster sizes, the SPEChpc 2021 provides four suites tiny, small, medium and large that includes different workload sizes as shown in the following table.
For more information about the SPEChpc 2021, visit the SPEChpc 2021 home page:
https://www.spec.org/hpc2021
ThinkSystem SR655 V3
The experiment performed on the Lenovo ThinkSystem SR655 V3, which is a 1-socket server that features the AMD EPYC 9004 "Genoa" family of processors. With up to 96 cores per processor and support for the new PCIe 5.0 standard for high performance GPU, the SR665 V3 provides the best system performance a 2U form factor.
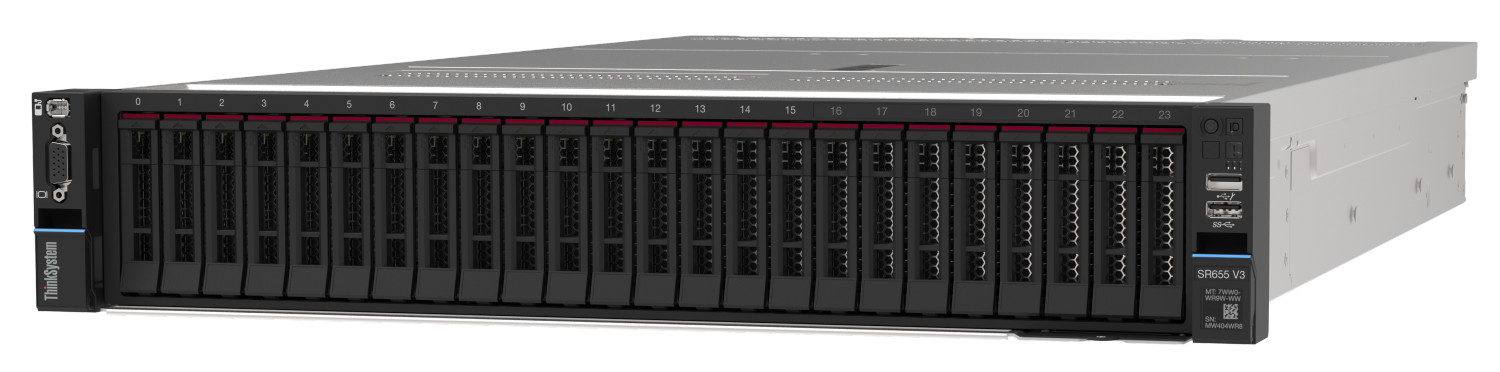
Figure 1. Lenovo ThinkSystem SR655 V3
For more information about SR655 V3, see the Lenovo Press product guide:
https://lenovopress.lenovo.com/lp1610-thinksystem-sr655-v3-server
The configuration used for the experiment consisted of the following:
- 1x Lenovo ThinkSystem SR655 V3 server
- 1x AMD EPYC 9654P Processor (96 cores, 2.45 GHz)
- 192 GB memory (12x 16GB RDIMMs running at 4800 MHz)
- 1x 480 GB SATA 2.5" SSD
- 1x NVIDIA Tesla H100 80GB
- Red Hat Enterprise Linux Server release 8.6, Kernel
Profiling SPEChpc 2021 sub-benchmarks
Targeting the artificial intelligence (AI), high-performance computing (HPC), and data analytics, the NVIDIA H100 80G PCIe 350W TDP (Thermal Design Power) GPU is composed of multiple GPU Processing Clusters (GPCs), Texture Processing Clusters (TPs), Streaming Multiprocessors (SMs), and memory controllers. The NVIDIA H100 GPU consists of:
The NVIDIA PCIe Gen 5 board form-factor H100 GPU includes the following units:
- 60 MB L2 Cache
- 80 GB HBM3
- 8 GPCs each contains 9 TPCs, total 72 TPCs
- 2 SMs per TPC, total 114 SMs
- Fourth Generation NVLink for cross GPU connection
NVIDIA provides powerful diagnostic tool called nvidia-smi for user to monitor GPU status, including SM utilization, SM clock frequency, memory footprint, memory operating clock, power consumption and so on.
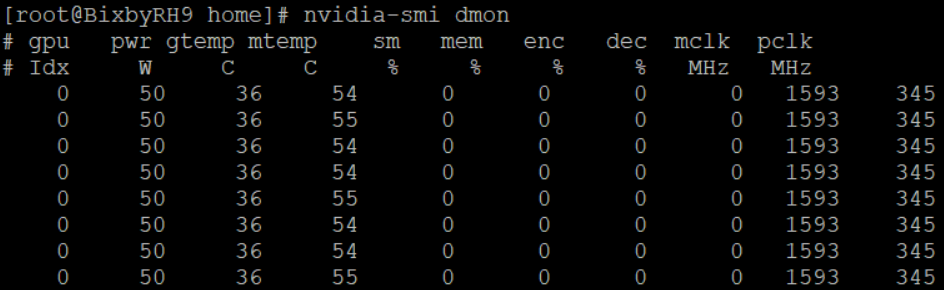
Figure 2. The nvidia-smi command with dmon argument use to monitor GPU status
Using the nvidia-smi command, we sampled the NVIDIA H100 GPU every second while running the SPEChpc 2021 benchmark to profiling the runtime behavior as documented in the following sections.
GPU utilization and frequency
Most sub-benchmarks fully utilize the GPU compute power, and the Streaming Multiprocessors (SM) utilization rate reaches 100% during the execution. Only x32’s utilization goes down to around 50% due to poor parallelization.
Although the utilization rate is high, the SM operating frequency varies among different benchmarks, the 505, 513, 528, 532 and 535 benchmarks can’t keep maximum frequency most of the time during the run.

Figure 3. GPU utilization and frequency when running SPEChpc 2021
GPU memory Utilization and frequency
The GPU memory utilization rate indicates the percent of time over the past sample period during which global (device) memory was being read or written. The 518, 519, 528 and 535 are memory bandwidth hungry so the memory utilization is above 90% during the run. The 505, 513, 521 and 534 consume less memory bandwidth, the utilization is around 40% to 70%. Since the less parallelization the memory utilization for the 532 is low (around 10% to 20%).
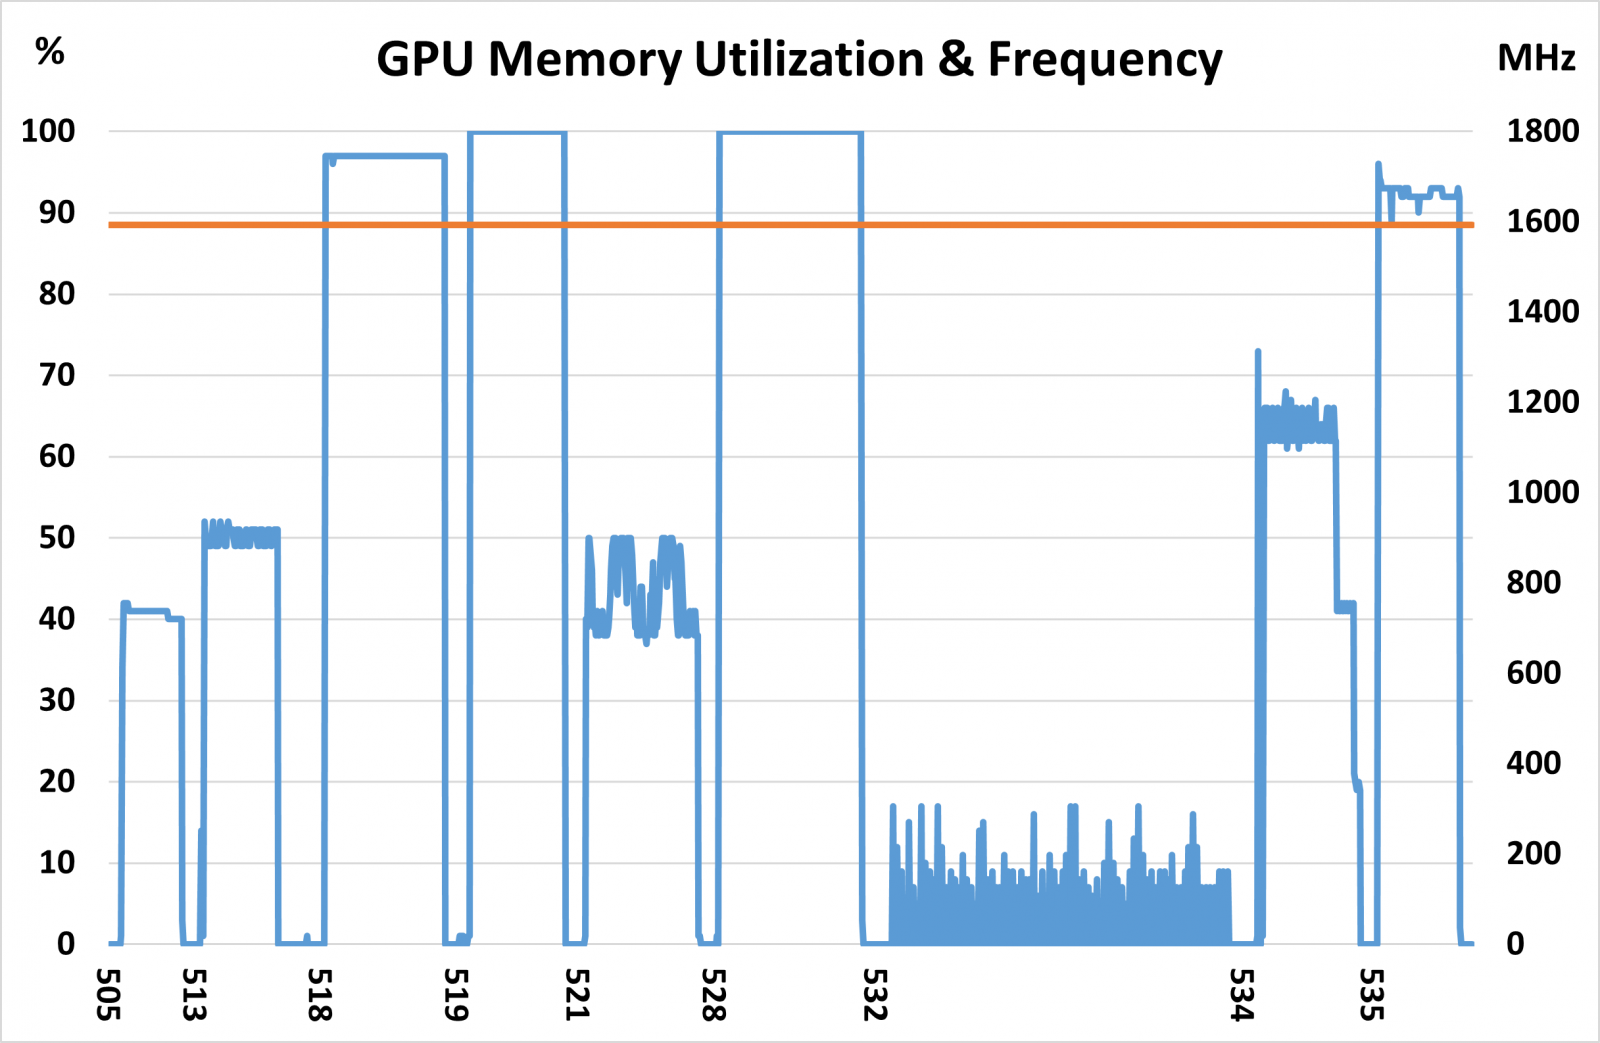
Figure 4. GPU memory Utilization and frequency of SPEChpc 2021
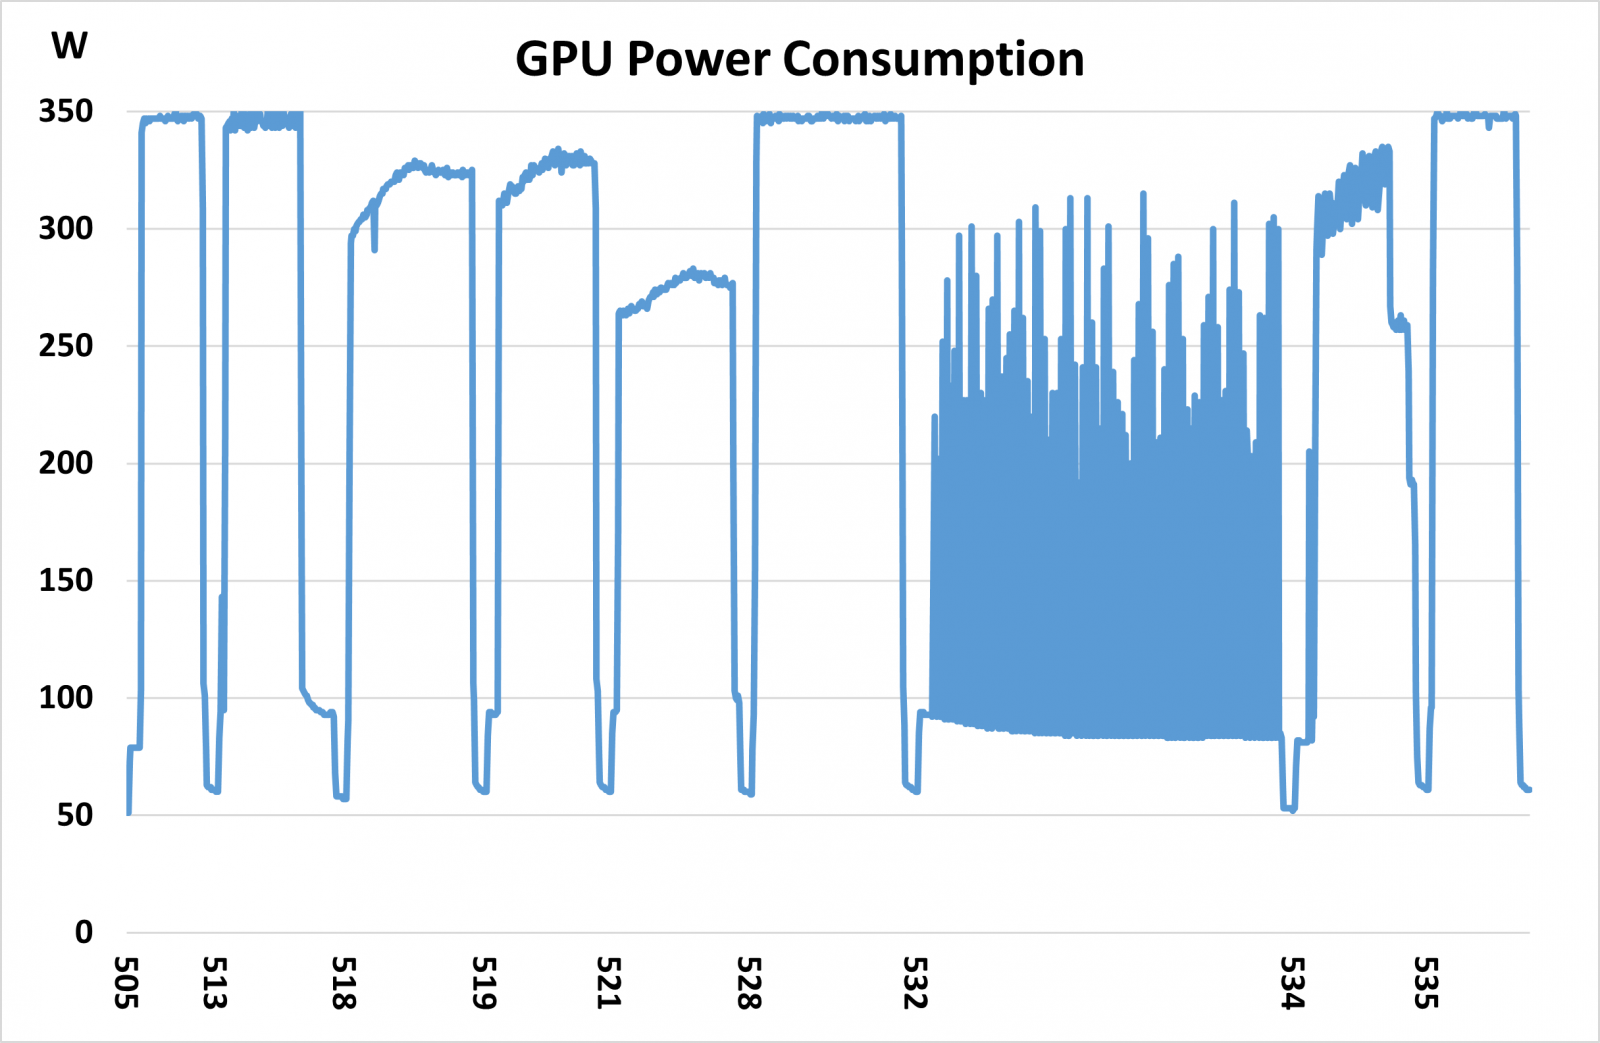
GPU power consumption
The chart below shows the power consumption without power level limitation, where the benchmark is able reach maximum 350W thermal design power (TDP) of the NVIDIA H100 GPU.
The 505, 513, 528 and 535 consume the maximum power during the benchmark execution, the 532’s power consumption goes up and down during the run because of low parallel optimization, and the power level for other benchmarks are range from 260W to 330W.
SPEChpc 2021 performance under different GPU power levels
The chart below illustrates related performance in percentage of each sub-benchmark of the SPEChpc 2021 under different power level of the H100 GPU from highest 350W to lowest 200W with 25W (about 7%) for each step.
The 505, 513, 528 and 535 are the most power sensitive sub-benchmark in the SPEChpc 2021 benchmark suite, 18% to 32% performance drop when power level set from 350W to 200W. At the other end of the scale, the 518, 519, 532 and 534 remain at least 87% of performance even if the power level drop 43%.
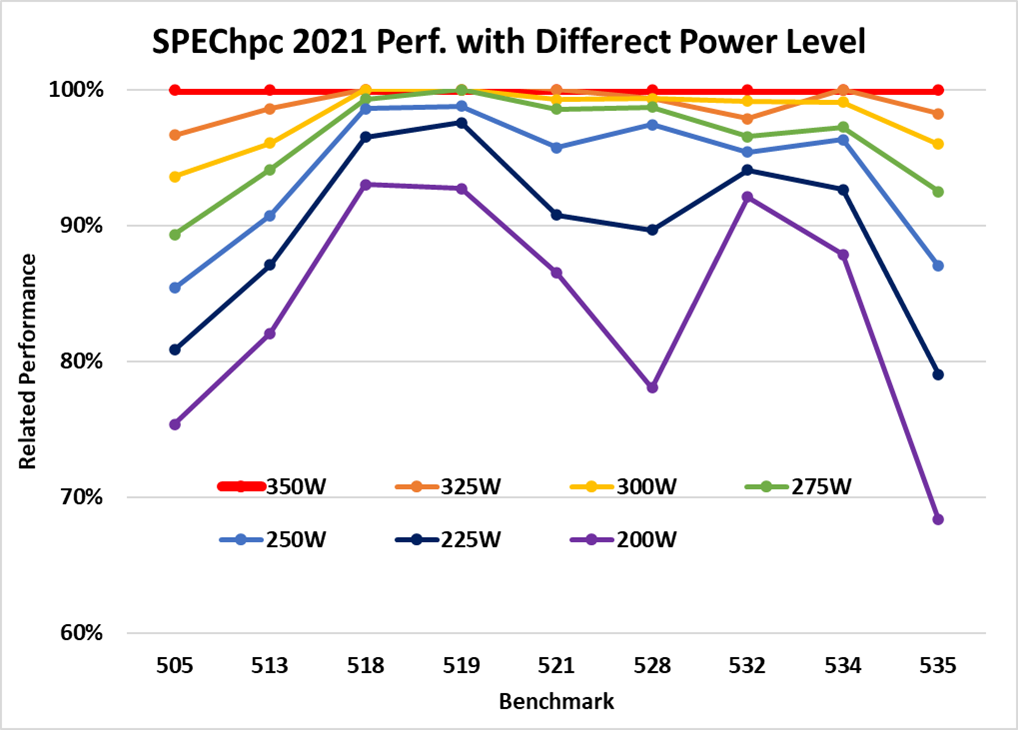
Figure 6. Relative performance of SPEChpc 2021 under different GPU power levels
Conclusion
The chart below combines the power level drop ratio and performance decreasing rate into one graph. Obviously, the slop of power level drop is much higher than performance drop, which means increasing the GPU TDP is not efficient way to improve the workload performance. In other words, a decrease in the TDP helps the GPU reach higher performance per watt if power consumption is more critical than absolute performance for the data center. It's important to find a balance between performance and power consumption to ensure optimal performance.
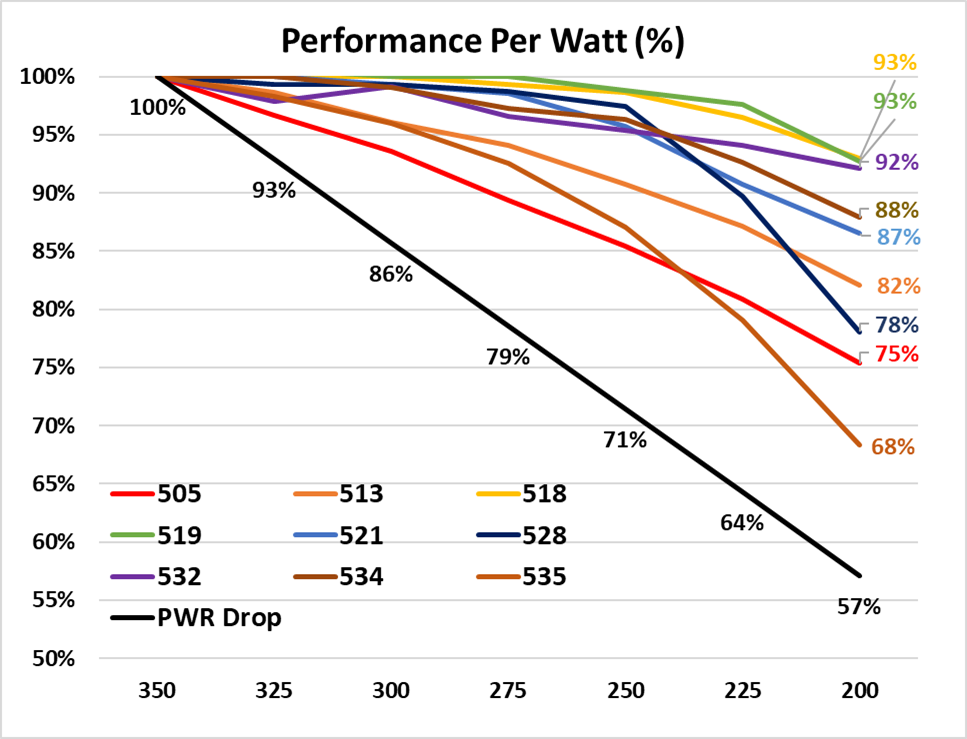
Figure 6. Power level drop ratio versus performance decrease rate
Authors
Jimmy Cheng is a performance engineer in the Lenovo Infrastructure Solutions Group Laboratory in Taipei Taiwan. Jimmy joined Lenovo in December 2016. Prior to this, he worked on IBM POWER system assurance and validation, ATCA system integration, automation development as well as network performance. Jimmy holds a Master’s Degree in Electronic and Computer Engineering from National Taiwan University of Science and Technology in Taiwan, and a Bachelor’s Degree in Computer Science and Engineering from Yuan-Ze University, Taiwan.
William Wu is a Principal Engineer and HPC system Architect in the Lenovo Infrastructure Solutions Group Laboratory in Taipei Taiwan. He has rich industrial experience including design digital IC, embedded system as well as high-density servers. His recently focus is on HPC system architecture research and development. William holds a Master’s Degree from National Chung Hsing University.
Trademarks
Lenovo and the Lenovo logo are trademarks or registered trademarks of Lenovo in the United States, other countries, or both. A current list of Lenovo trademarks is available on the Web at https://www.lenovo.com/us/en/legal/copytrade/.
The following terms are trademarks of Lenovo in the United States, other countries, or both:
Lenovo®
ThinkSystem®
The following terms are trademarks of other companies:
AMD and AMD EPYC™ are trademarks of Advanced Micro Devices, Inc.
Linux® is the trademark of Linus Torvalds in the U.S. and other countries.
SPEC® and SPEChpc™ are trademarks of the Standard Performance Evaluation Corporation (SPEC).
Other company, product, or service names may be trademarks or service marks of others.
Configure and Buy
Please select a locale
Full Change History
Course Detail
Employees Only Content
The content in this document with a is only visible to employees who are logged in. Logon using your Lenovo ITcode and password via Lenovo single-signon (SSO).
The author of the document has determined that this content is classified as Lenovo Internal and should not be normally be made available to people who are not employees or contractors. This includes partners, customers, and competitors. The reasons may vary and you should reach out to the authors of the document for clarification, if needed. Be cautious about sharing this content with others as it may contain sensitive information.
Any visitor to the Lenovo Press web site who is not logged on will not be able to see this employee-only content. This content is excluded from search engine indexes and will not appear in any search results.
For all users, including logged-in employees, this employee-only content does not appear in the PDF version of this document.
This functionality is cookie based. The web site will normally remember your login state between browser sessions, however, if you clear cookies at the end of a session or work in an Incognito/Private browser window, then you will need to log in each time.
If you have any questions about this feature of the Lenovo Press web, please email David Watts at dwatts@lenovo.com.


