

Top
Updated
28 Jun 2021Form Number
LP1495PDF size
20 pages, 602 KBSubscribed to LP1495.
Thank you for your feedback.
Abstract
Network Functions Virtualization (VNFs) have become a fundamental technique of modern networks. NFVs bring unique benefits related to flexibility, deployment and configuration agility, and cost. They have been deployed to support a wide range of technologies, in particular modern infrastructure providing communication services for the Edge, IoT (Internet of Things), and MEC (Multi-Access Edge Computing).
Lenovo delivers NFVs and partner solutions that solve challenges and enable new CoSP revenue at the edge, near edge, central office, and smart solutions.
This paper will highlight techniques to optimize the performance of Network Functions Virtualization (NFVs) in terms of latency and throughput. This article was developed for IT architects, development engineers, marketing, and sales professionals. It is assumed that the audience is familiar with basic networking, operating systems, and virtualization concepts.
Change History
Changes in the June 28, 2021 update:
Minor formatting changes
Introduction
The ubiquitous use of virtual machines to process network traffic in modern communication and computing infrastructure has exposed limitations and obstacles to system scalability. These challenges call for innovative performance optimization strategies.
On the one hand, networks are rapidly evolving to support new use-cases, including mobile edge computing, network slicing in 5G, orchestration engines, video analytics, security, and SD-WAN (Software-Defined Wide Area Networks), to name a few. On the other hand, Network Functions Virtualization (NFVs) are becoming a fundamental building block for many of these environments.
With the advent of Network Functions Virtualization, virtual machines became a core element of packet processing. Despite their flexibility, cost, elasticity, and security advantages, Network Functions Virtualization has the difficult task of sharing computational resources while running alongside other workloads.
Lenovo’s deep technical partnerships with industry leaders ensures that Communications Service Providers (CoSPs) can choose among the highest performance and optimized solutions with confidence.
These collaborations enable Lenovo to simplify the selection and deployment of hardware and software needed for today’s network workloads and to accelerate Communications Service Providers’ (CoSPs) migration to Network Functions Virtualization (NFV).
With the latest Intel® Select Solutions for NFVi Forwarding Platform Reference Design, CoSPs can plan their development efforts to achieve Control and User Plane Separation (CUPS), ensuring low network Edge latencies and maximum efficient use of resources. As a key component of these offerings, Network Functions Virtualization allow the deployment of networks faster, while also reducing costs, and scaling endlessly.
This paper describes techniques to assess Network Functions Virtualization performance and strategies to optimize latency and throughput. To that end, a network stress test framework was developed to automate the collection of performance metrics. Once a baseline was established, the effect of several optimization strategies and their performance impact was evaluated. Finally, we consolidated insights and recommendations about the most efficient performance optimization techniques for different use-cases.
Lenovo ThinkSystem SR650 and SR630 servers were used in the development labs, where stringent workload and traffic scenarios were tested, and optimization techniques evaluated.
The optimization techniques considered include CPU reservation methods, process scheduling priority, process I/O priority, memory allocation, storage allocation, storage access methods, caching, and batch processing applied to received packets. For each strategy, a variable number of workloads were deployed in computing hosts. Throughput and latency were measured, and the effectiveness of each strategy (increasing bandwidth, decreasing latency) was analyzed.
Based on our experience, there is no one-size-fits-all when it comes to optimizing network performance. Nevertheless, there are guidelines applicable to specific parameters (i.e., throughput, latency) and the system's scale.
Test Environment
Our test environment's foundation consists of commodity servers running a Linux-based operating system with virtualization enabled using KVM, QEMU, and libvirt.
- KVM (Kernel-based Virtual Machine) is a virtualization module in the Linux kernel, which gives the kernel the ability to function as a hypervisor.
- QEMU (Quick EMUlator) is an open-source emulator capable of emulating a machine's processor. It provides several device models that enable machines to run various guest operating systems. When used alongside KVM, it allows virtual machines to run at near-native speed by taking advantage of hardware extensions such as Intel VT-x.
- libvirt is an open-source API, daemon, and management tool that can orchestrate the virtualization functions performed by KVM and QEMU.
The figure below depicts the relationships between these elements in a typical server:
As a terminology note, we will use the terms server and compute node interchangeably throughout this document.
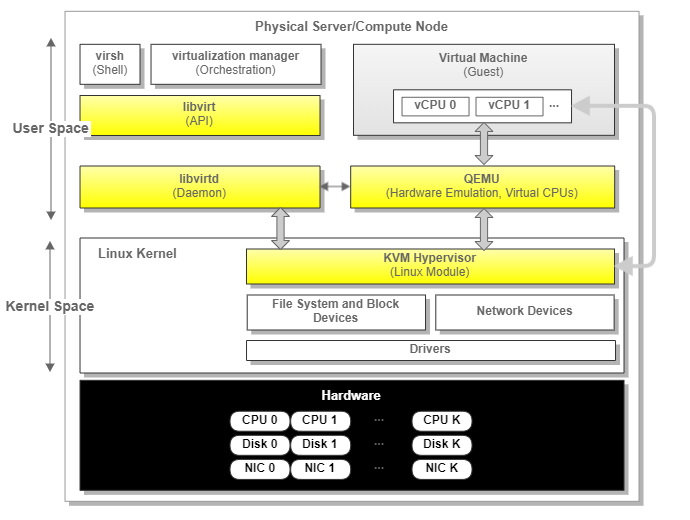
Figure 2. Server Virtualization Components
The virtualized servers are used to deploy application workloads, which are virtual machines running the user's applications (e.g., web servers, databases). To perform their functions, these applications typically communicate with each other. In some cases, the communication is local within the same infrastructure (i.e., data center, edge location). In contrast, in other cases, these applications communicate with external hosts (i.e., outside the data center, remote sites, public Internet).
This paper's scope comprises network traffic flowing among application workloads running in different servers within the same infrastructure or facility. The decision to focus on the "East-West" traffic is based on [10]. There it is shown that this direction comprises around 80% of the data-center traffic. In the upcoming diagrams and descriptions, we will refer to this environment as an on-prem infrastructure.
The following diagram represents the relevant traffic flows with the blue arrows.
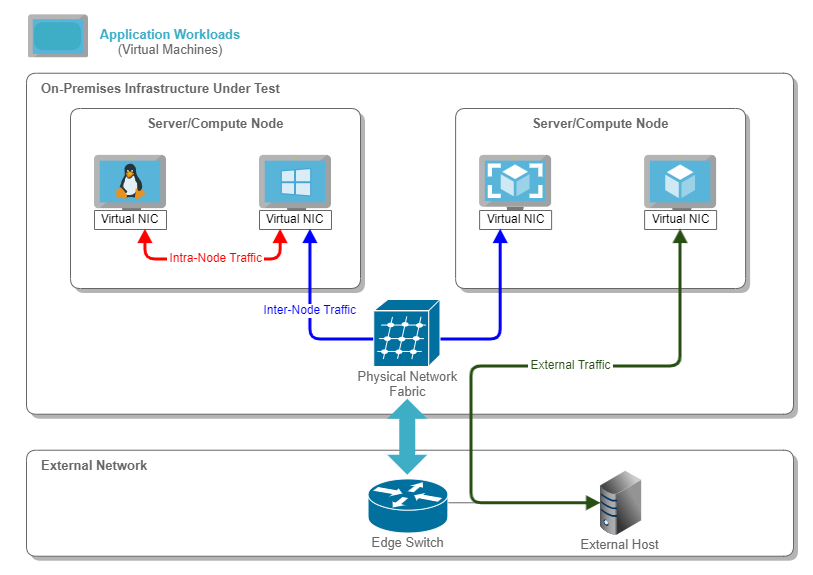
Figure 3. Sample Application Workload Traffic Flows
Virtual Networks
Network traffic associated with application workloads is processed based on the concept of Virtual Networks (VNET). In these networks, packets produced by virtual machines are first converted to physical network packets. They are then tunneled or translated through the physical network until they reach the receiving endpoint. They are converted back to the virtual network context and delivered to the receiving endpoint. The overlay network provides the agility needed to support modern applications, whereas the underlay network offers robustness.
A VNET can be understood as a logical Layer 2 network, which implements a broadcast domain. Therefore, VNETs are functionally similar to traditional ones.
Network Functions Virtualization (NFV)
Network Functions Virtualization (NFVs) are virtualized network services running on open computing platforms formerly carried out by proprietary, dedicated hardware technology. Common NFVs include virtualized routers, firewalls, load-balancers, WAN optimization, and network address translation (NAT) services.
Most NFVs are run in virtual machines (VMs) on standard virtualization infrastructure software. Throughout this document, we will refer to these specialized virtual machines as NFV VMs.
Given the Layer 2 nature of the VNETs, the NFV VMs act as the routing gateways or next hop for application workloads communications targeting destinations sitting on different VNETs. In other words, L3 routing is performed within the NFV VM to allow communication between distinct VNETs.
In our test environment, we configured two vNICs (Virtual Network Interface Cards) per NFV VM. The internal vNIC is used for communication with other application workload vNICs within that same VNET. In contrast, the external vNIC is used to communicate externally to other VNETs.
The following figure represents a NFV VM and its components, highlighting the internal and external vNICs.
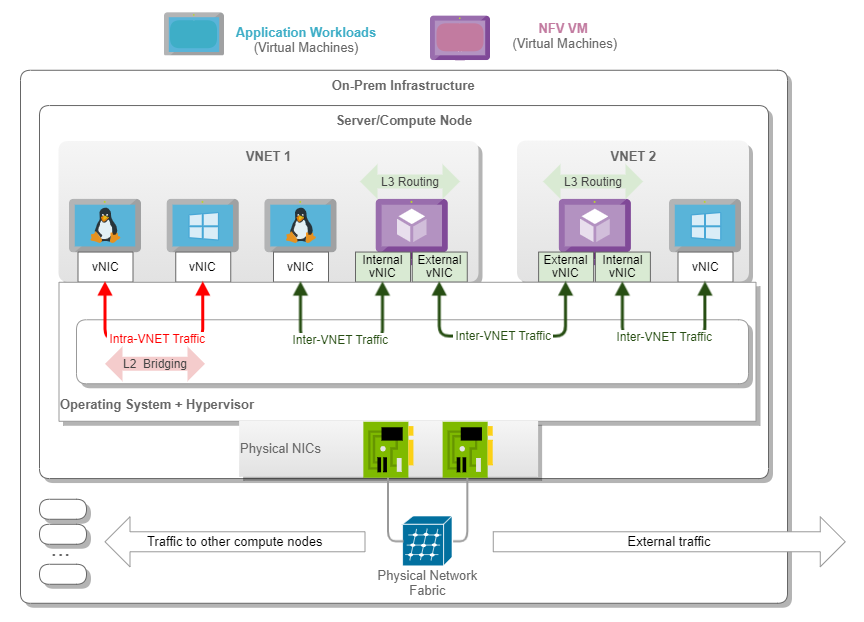
Figure 4. NFV VM and Traffic Flows in a Single Server
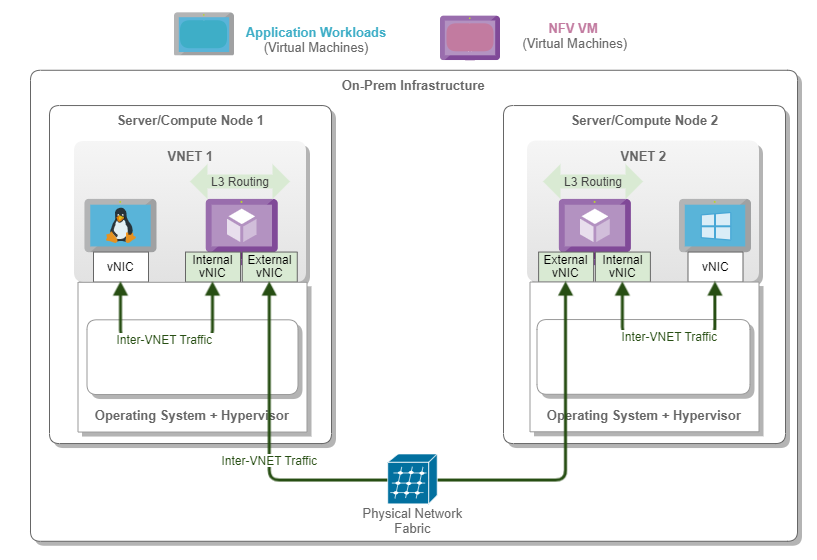
The following diagram depicts a typical flow between two application workloads running in two distinct VNETs deployed in different servers.
Stress Test Framework
Scalability and stability are essential aspects of any modern distributed computing infrastructure. As a key player in this space, Lenovo constantly designs and manufactures systems that exceed customer expectations.
In line with this strategy, we saw the need to evaluate the network performance of application workloads deployed as virtual machines under stress conditions.
The first step consisted of developing a suitable test framework, which would allow us to detect performance bottlenecks, identify stress points, and provide benchmarking capabilities.
The upcoming sections describe the framework and how it was leveraged to enable metrics collection and analysis.
For brevity, we will refer to application workload virtual machines simply as application VMs. Likewise, we will refer to the specialized virtual machines running the virtualized network functions as NFV VMs.
Test Topology
The testing topology consists of two physical servers, each hosting a fleet of application VMs and logically grouped into two different VNETs.
We considered the following options:
- Topology A: NFV VM for each VNET runs in the same server as the application VMs belonging to the same VNET.
- Topology B: NFV VM for each VNET runs in the other server as the application VMs belonging to that VNET.
- Topology C: Both NFV VMs run on the same server. This topology has several variants, depending on the specific servers hosting the NFV VMs and the distribution of application VMs across servers.
- Topology D: Extend the basic topology to include a third server in which the NFV VMs run. Application VMs are started in the other two servers. Although this topology is theoretically attractive, it may lead to extra resource consumption and complexity without clear benefit.
We conducted lab tests leveraging all four topologies highlighted. During the process, we realized that:
- There is no one-size-fits-all topology.
- Executing tests on a wide variety of topologies is cumbersome, and it is hard to reason and draw valid conclusions.
Therefore, for this paper's scope, we decided to build the framework based on Topology A. As a result, all application VMs belonging to a given VNET will run in the same server where the corresponding NFV VM is deployed. In production deployments, this is unlikely to happen. However, it is a reasonable and acceptable approach that simplifies both the actual testing framework and its analysis.
The following diagram depicts the topology employed in our framework.
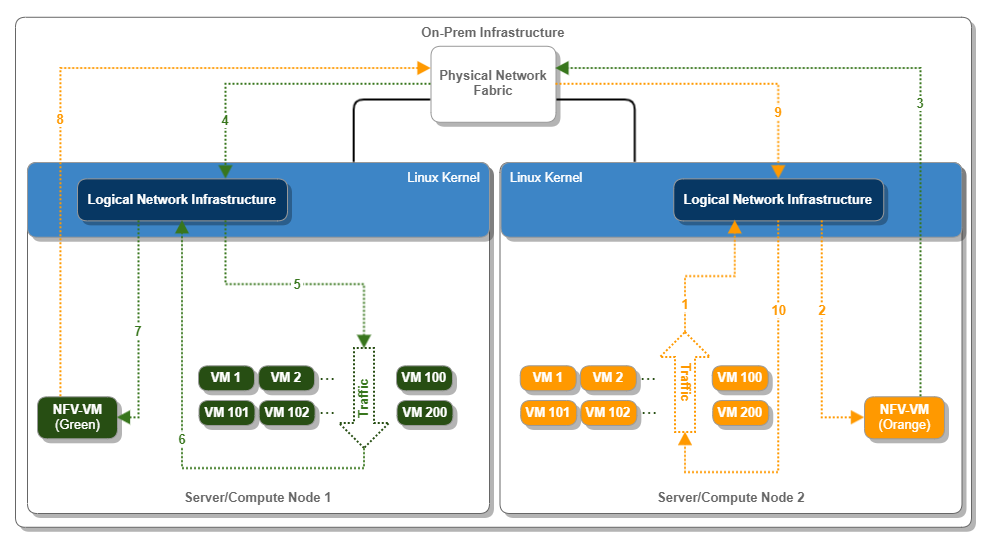
Figure 6. Stress Test Topology and Basic Flows
A few notes about the previous diagram:
- The Network Infrastructure block represents the Linux Kernel portions responsible for controlling, processing, and filtering packets as they are sent or received by virtual machines.
- The orange and green arrows represent the traffic flowing among the green and orange application VMs.
- Regarding the traffic flow terminology, we will refer to this traffic as North-South because it crosses the logical boundaries of each VNET. Note that this is not the North-South traffic as related to the data center itself. This is still "East-West" traffic from the data center standpoint.
- It is essential to highlight that we did not evaluate any traffic sourced or destined to a host outside the on-prem infrastructure network. The rationale is that such traffic goes through network components outside of the NFV control, our analysis's primary target.
- The arrow with sequential numbers from 1 to 10 is a high-level depiction of the path takes by packets flowing between the two sets of application VMs.
NST (Network Stress Test) Framework
The NST framework was developed in-house by Lenovo engineers. It is a combination of open-source software and proprietary scripts.
Purpose
The main goal of the NST framework is to collect throughput, latency, and jitter information., which are defined as follows:
- Throughput: Maximum number of operations (e.g., data a device or system can transfer send/receive) per time unit – RPS/QPS, Mbps, Kbps.
- Latency: Time it takes for data to go through a device or system – s, ms, us.
- Jitter: The latency variation on a packet flow between two systems when some packets take longer to travel from one system to another. We will not cover jitter in the following sections. However, we did collect the data for future analysis.
The collection takes place inside each application VM while steady traffic purposely flows through the network.
In other words, the setup consists of starting application VMs on the participating servers and measuring the approximate throughput, latency, and jitter observed from the perspective of each individual application VM.
The framework is extensible, and it can collect other metric types. This is accomplished simply by sending any generic Linux command to all application VMs and collecting the relevant data. For example, the framework has been used to gather IOPS information. Nonetheless, this kind of capability and potential extensions are out of the scope of this paper.
Framework High-Level Details
At a very high level, NST creates two types of application VMs called clients and servers. All clients are logically bound to one VNET and, hence, to one compute node. In contrast, all VMs playing the servers' role are bound to the other VNET and its corresponding compute node. Clients and servers are paired based on their IP addresses so that each client communicates with precisely one server, as shown in the following picture.
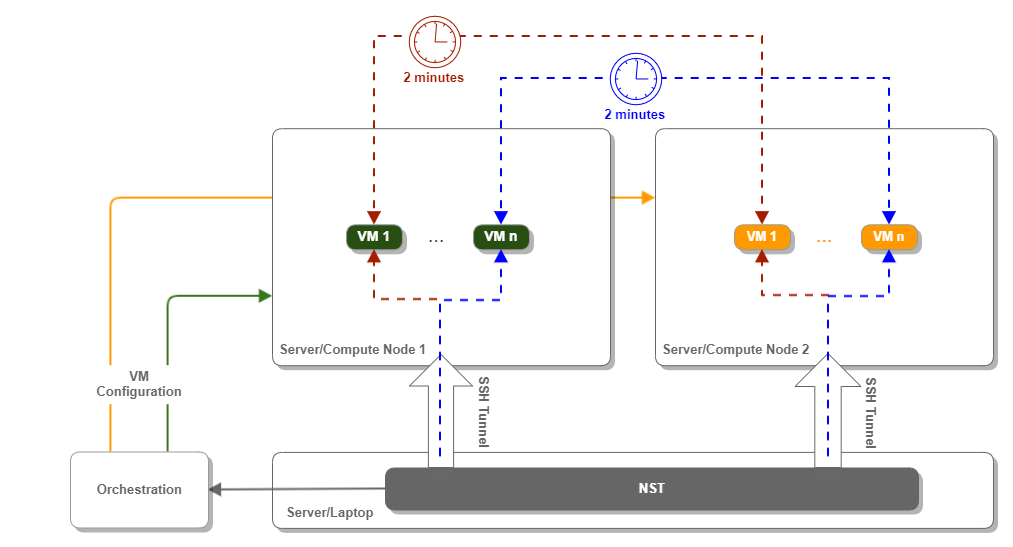
Figure 7. Networking Stress Test Framework and Client/Server Detail
The NST framework operates based on the worst-case scenario, where all clients start communicating with the corresponding servers simultaneously. Furthermore, clients try to inject as much traffic as they possibly can.
The traffic measurement utilities we are using are qperf and iperf.
The qperf utility is used to determine the TCP throughput and latency, whereas iperf is used to assess jitter.
It is relevant to mention that these tools are not 100% reliable, and multiple test iterations lead to slightly different results. Moreover, other metrics such as median and percentiles provide more insights into worst-case scenario trends as suggested in [5]. Nonetheless, the key objective of this work is to provide guidelines. Therefore, we are more interested in trends than absolute numbers (e.g., latency decreases as a function of specific parameter changes).
We decided not to measure UDP performance because, as we indicated earlier, all application VMs send as much traffic as they can from the beginning. As UDP is a very aggressive protocol, we would end up with a few application VMs consuming all available resources with no flow control mechanisms.
The host operating system deployed in the com servers is Linux based on RedHat 7.5 (RHEL) distro. We leveraged the QEMU KVM and libvirt packages from the RedHat virtualization repository (RHEV) for virtualization. The application VMs operating system is a minimal RedHat 7.4 installation where we have just added the qperf and iperf packets.
Optimization Strategies
As Figure 5 indicates, the NFV VM must route all traffic flowing between the client and server application VMs associated with different VNETs.
The NFV VM is deployed as a virtual machine, which uses the Linux kernel as the routing engine. As a result, we realized that we had many potential avenues for improvement by modifying how the NFV VM is treated, managed, and controlled by the host machine kernel/hypervisor.
In the following sections, we will first discuss the methodology used to establish our baseline. Then, we will describe the various strategies that can be used to tune the way the host machine kernel/hypervisor manages the NFV VM.
Baseline
The test setup depicted in Figure 6 is used for all data collections.
We defined our baseline as the performance data collected using the default settings in force within the servers. These settings match the default configuration, which comes out of the box with the RHEL (Operating System) and RHEV (Virtualization).
Strategies
The following table summarizes the optimization strategies considered
In the upcoming sections, we will go into detail about each strategy.
CPU Reservation
This strategy is exemplified in [1]. It involves setting processors and processing core affinities for hypervisor guests using services provided by the virtualization library. Our test environment operates using the libvirt virtualization library and the KVM hypervisor. By default, libvirt provisions guests using the hypervisor's default policy. For most hypervisors, the approach is to run guests on any available processing core or CPU.
Hence, our idea consisted of controlling the processing core affinity for the NFV VMs only.
This led us to conceive two approaches:
- Pinned: Pin the NFV VM to a specific core while still allowing all the other application VMs to use it.
- Reserved: Pin the NFV VM to a specific core, but do not allow any other application VM to use this core. In this scenario, note that the host operating system itself can still use this core.
For the sake of consistency and simplicity, we decided to pin the NFV VMs to the last available core (e.g., core 27 out of 28 available cores, since core numbers are zero-based).
The reasoning for these settings is to exploit cache locality. Pinning allows VMs to take advantage of L1 and L2 caches, which are core-specific, more efficiently. Besides, the reserved core strategy relieves pinned cores from processing interrupts from network cards and storage controllers.
Process Priority
The default behavior of operating systems in virtualized environments is to prioritize virtual machines after all other processes. This observation opens the door for a second optimization strategy, increasing the priority assigned to the NFV VMs.
There are two different priorities, which can be modified for this purpose:
- Process Priority: [8] explains a method that can be leveraged to increase the scheduling priority of the NFV VMs. Theoretically, these settings would allow the NFV VMs to process packets more often. On the other hand, this may expose the NFV VMs to a vast volume of computations under heavy traffic conditions. Therefore, there is a risk that this prioritization could starve all the other processes. To minimize such a risk, and based on [7], we decided to increase the NFV VM priority to the value -10, which sits in the 75% percentile, but it is not the highest priority. As a side note, Linux uses a priority system with 40 priorities, ranging from -20 (highest priority) to 19 (lowest priority). Processes started by regular users usually have priority 0. This is precisely the default priority assigned to the application VMs in our platform.
- I/O Priority: [6] describes a technique that can be used to increase the I/O scheduling class for the NFV VMs. Each class is assigned a priority from 0 to 7, with the smallest number mapping the highest priority. For this study, we focused on the following classes:
- Best Effort: This is the class commonly associated with processes.
- Real-Time: Processes mapped to this class are always granted first access to I/O.
Our proposal was to map the NFV VMs to both classes and pay special attention to the real-time class's performance impact. It is relevant to highlight that caution is required with this approach because it may starve other processes.
Memory and Storage
Networking stress tests, by nature, imply a lot of memory accesses. For each received packet, NFV VMs need to check both the routing and ARP tables. As a result, we realized that leveraging memory optimization techniques can make a lot of sense. We proposed the use of Kernel Same-Page Merging (KSM).
KSM [3] allows multiple KVM virtual machines to share identical memory pages. This avoids memory duplication at the cost of more significant write times. The system first needs to check if there are any pages similar to the one queued for writing.
One must keep in mind that disabling this setting affects all virtual machines.
Packet Processing
Like physical interfaces, packets being received by VMs can be batched before being delivered to the guest operating system kernel [2]. Grouping received packets saves time with the interrupt handling in the kernel, improving caching utilization.
KVM VMs can be configured to batch multiple packets before processing them. We have configured the NFV VMs to batch 10 packets before processing them.
Results
We have performed tests while running the following number of application VMs: 10, 100, and 200.
The lowest number is helpful to analyze the system under "normal" conditions. The 100 VMs are probably at the far end of the "normal" conditions, whereas 200 VMs generate stress conditions for the system under test.
For each number of VMs, we ran 100 iterations, where each iteration consists of the following steps:
- Start the VMs.
- Pair the VMs (i.e., establish a client->server connection in the qperf terminology).
- Send traffic from the clients to the servers for 2 minutes.
- Collect the performance results for each VM.
- Wait for 2 minutes.
Using this algorithm, we gathered the following number of data points throughout the 100 iterations:
For each set of data points, we extracted the following metrics, whose calculation method are described at [9]:
- 50% percentile
- 90% percentile
- 95% percentile
- 99% percentile
The 50% percentile represents the typical case. The higher percentiles allow us to consider the worst-case scenarios, the shape of the distribution, and its variance. According to [5], two considerations are essential:
- Percentiles tell us more than averages: Percentiles allow us to consider the shape of the distribution and its differing attributes. For instance, a high-order percentile, such as the 99th or 99.9th, shows you a plausible worst-case value. Using the 50th percentile (also known as the median) emphasizes the typical case. The higher the variance in response times, the more the specific user experience is affected by long-tail behavior.
- Higher percentiles are more relevant to the end user's experience: Imagine that we have 1,000 data points. The goal of our system is to meet a latency requirement of fewer than 200 milliseconds. Let's say that the average latency measured is 75 milliseconds, but 5% of the packets experience a latency of 10 seconds. Even though on average, the system meets the requirements, the long-tail or worst-case may be unacceptable. The 5% of the users facing 10 seconds latency will probably stay away from this product. User studies cited suggest that people usually prefer a slightly slower system to high variance in response times.
Comparative Results Tables
Below are the results between all the strategies compared to the baseline measurements. We have highlighted in green the best plan for each pair (metric, number of VMs).
Due to space limitations, we used short table headers, and here is the mapping between the columns in the table and the strategies we evaluated:
Result Analysis
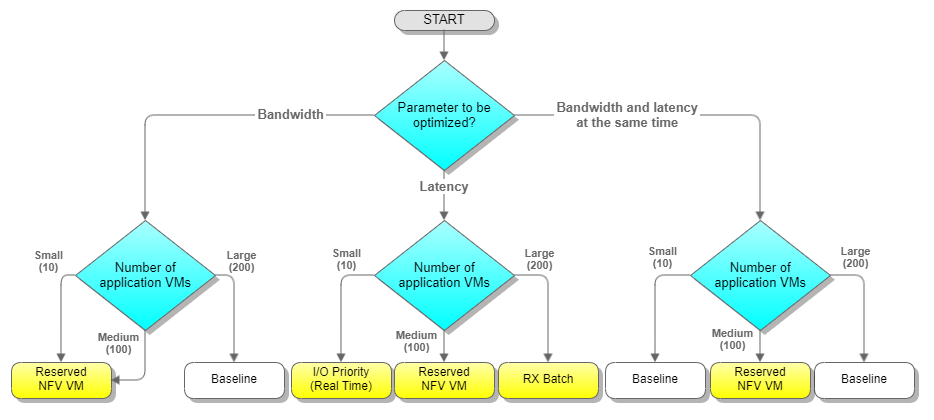
After analyzing all the data, the conclusion is that there is no "one size fits all" answer. The optimization strategy depends on the number of application VMs started and the relevant parameter into consideration (i.e., throughput or latency).
Based on the results, we were able to draw the following conclusions:
- For a small number of VMs, if we want to optimize the throughput, the best strategy is to reserve a core for the NFV VM. But suppose our goal is to optimize the latency. In that case, the best approach consists of increasing the I/O priority of the NFV VM.
- For many VMs, the best strategy to optimize the throughput is to use the default Linux and KVM settings. However, for optimizing the latency, then RX batching is the best option.
- For a fair number of VMs (without stressing the system), the best strategy to optimize both throughput and latency at the same time is to reserve a CPU core for the NFV VM.
- For a large number of VMs, it is challenging to optimize both throughput and latency simultaneously.
The following diagram summarizes the best strategy for the number of VMs and the metric being optimized. Depending on use cases, other metrics can be used, which might highlight different better strategies.
Conclusion
This study's main conclusion is that the number of VMs greatly influences what strategy is better to optimize the throughput and latency. There is no single nor straightforward answer. It depends on the system use case. Sometimes one needs to sacrifice some throughput performance to gain better latency and vice-versa.
There are two possible directions to follow to make an even more data-driven decision when configuring the most efficient environment for virtualized network functions.
One is to find some more singular strategies (e.g., reserve a part of the CPU L3 cache for the NFV VM).
The second direction is to combine various singular strategies (e.g., reserved NFV VM and I/O priority with real-time class, RX batching plus pinning NFV VM, etc.).
Ultimately, the best recommendation is an adaptive strategy based on the system's scale and the specific parameter, which is more relevant for the use case. Many systems, which provide the back end to user-facing services focus on latency. Some examples of such systems include social media newsfeed, E-commerce applications, video streaming platforms, etc. On the other hand, batch processing systems typically give more relevance to throughput.
References
[1] "33.8.Setting KVM Processor Affinities Red Hat Enterprise Linux 5." Red Hat Customer Portal, access.redhat.com/documentation/en-us/red_hat_enterprise_linux/5/html/virtualization/ch33s08.
[2] "5.5. Batching Network Packets Red Hat Enterprise Linux 7." Red Hat Customer Portal, access.redhat.com/documentation/en-us/red_hat_enterprise_linux/7/html/virtualization_tuning_and_optimization_guide/rx_batching.
[3] "8.3. Kernel Same-Page Merging (KSM) Red Hat Enterprise Linux 7." Red Hat Customer Portal, access.redhat.com/documentation/en-us/red_hat_enterprise_linux/7/html/virtualization_tuning_and_optimization_guide/chap-ksm.
[4] "9.3. Libvirt NUMA Tuning Red Hat Enterprise Linux 7." Red Hat Customer Portal, access.redhat.com/documentation/en-us/red_hat_enterprise_linux/7/html/virtualization_tuning_and_optimization_guide/sect-virtualization_tuning_optimization_guide-numa-numa_and_libvirt.
[5] Beyer, Betsy, et al. Site Reliability Engineering: How Google Runs Production Systems. O'Reilly, 2016.
[6] Ionice(1) - Linux Man Page, linux.die.net/man/1/ionice.
[7] "Learn Linux, 101: Process Execution Priorities." IBM Developer, developer.ibm.com/tutorials/l-lpic1-103-6/#:~:text=Linux%20and%20UNIX%C2%AE%20systems,)%20using%20the%20%2Dl%20option.
[8] Renice(1) - Linux Manual Page, man7.org/linux/man-pages/man1/renice.1.html.
[9] Wikipedia contributors. “Percentile.” Wikipedia, 25 Mar. 2021, en.wikipedia.org/wiki/Percentile.
[10] Trends in Data Center Security: Part 1 – Traffic Trends, https://blogs.cisco.com/security/trends-in-data-center-security-part-1-traffic-trends
Trademarks
Lenovo and the Lenovo logo are trademarks or registered trademarks of Lenovo in the United States, other countries, or both. A current list of Lenovo trademarks is available on the Web at https://www.lenovo.com/us/en/legal/copytrade/.
The following terms are trademarks of Lenovo in the United States, other countries, or both:
Lenovo®
ThinkSystem®
The following terms are trademarks of other companies:
Intel®, the Intel logo is a trademark of Intel Corporation or its subsidiaries.
Linux® is the trademark of Linus Torvalds in the U.S. and other countries.
IBM® and ibm.com® are trademarks of IBM in the United States, other countries, or both.
Other company, product, or service names may be trademarks or service marks of others.
Configure and Buy
Please select a locale
Full Change History
Changes in the June 28, 2021 update:
Minor formatting changes
Course Detail
Employees Only Content
The content in this document with a is only visible to employees who are logged in. Logon using your Lenovo ITcode and password via Lenovo single-signon (SSO).
The author of the document has determined that this content is classified as Lenovo Internal and should not be normally be made available to people who are not employees or contractors. This includes partners, customers, and competitors. The reasons may vary and you should reach out to the authors of the document for clarification, if needed. Be cautious about sharing this content with others as it may contain sensitive information.
Any visitor to the Lenovo Press web site who is not logged on will not be able to see this employee-only content. This content is excluded from search engine indexes and will not appear in any search results.
For all users, including logged-in employees, this employee-only content does not appear in the PDF version of this document.
This functionality is cookie based. The web site will normally remember your login state between browser sessions, however, if you clear cookies at the end of a session or work in an Incognito/Private browser window, then you will need to log in each time.
If you have any questions about this feature of the Lenovo Press web, please email David Watts at dwatts@lenovo.com.


